
Covid-19 deaths 93% lower than SAGE model
SAGE Models vs. Reality: The Receipts
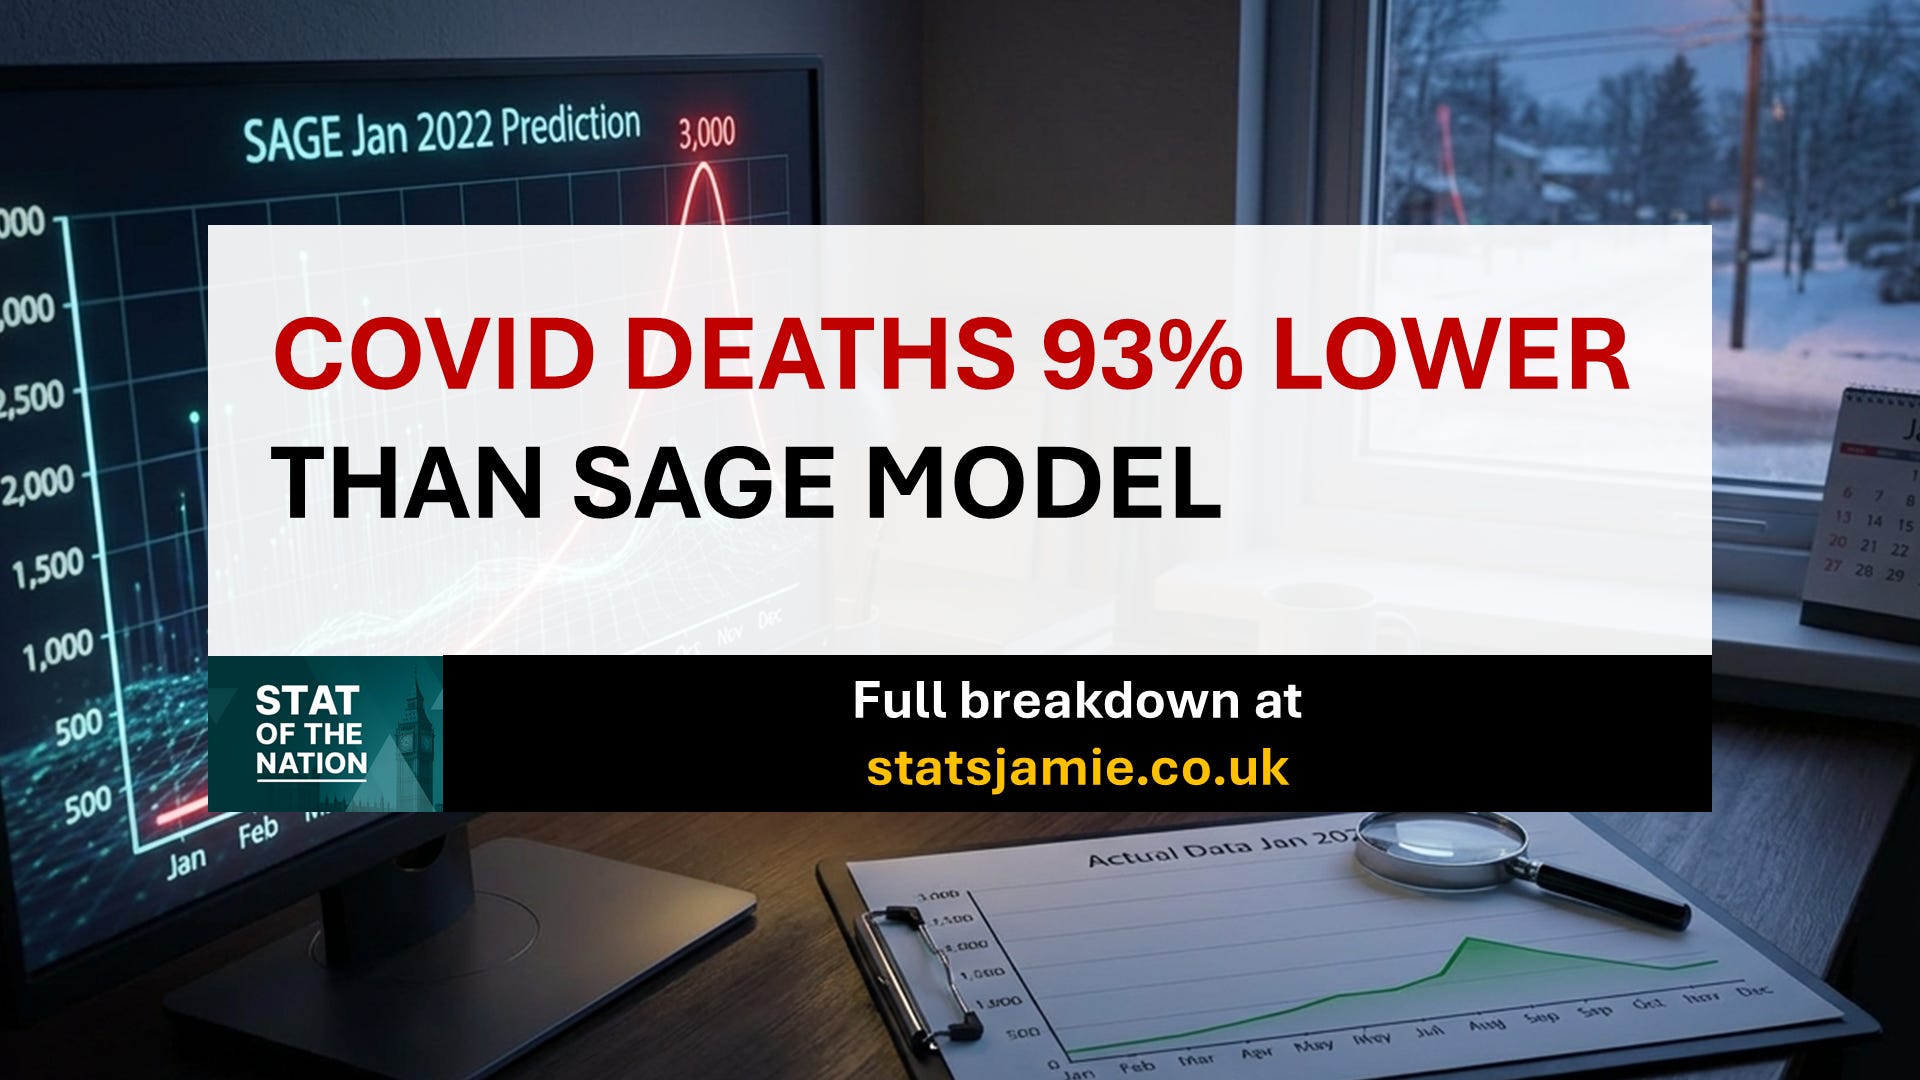
I recently wrote looking at the outcome of deaths in January compared with the SAGE modelling before Christmas. I said it would be clearer when more data was available from the ONS, so have updated the blog with this. The official data shows that the reality was the peak in Covid-19 deaths was 93% lower than the SAGE model used to call on Boris Johnson to issue more restrictions.
Previous modelling was way out
Back in September, SAGE warned of around 3,000 hospitalisations per day if the Government did not introduce Plan B in England. The Government ignored this and admissions never rose above 900 per day. As the Omicron wave hit the UK, the Government introduced Plan B measures on December 15th. SAGE modellers then warned of up to 3,000 deaths per day in January without further restrictions. The Prime Minister rejected the calls for more restrictions.
A milder variant and mass vaccination but predictions of more deaths than last winter
Early on from the identification of Omicron, experts in South Africa repeatedly told the world it was less severe than the Delta variant. However, SAGE came up with a range of scenarios predicting large numbers of deaths without further restrictions in England. Modellers at Warwick University predicted if Omicron was 50% less severe than Delta and 6 million booster vaccine doses went into arms each week, we would see peak deaths linked to Covid-19 of 2,890 per day in January. This is if England did not see further restrictions beyond Plan B. As with all models, there was a range, with a best-case scenario of 1,800 deaths per day and a worst-case scenario of 4,770.
The worst-case scenario was close to a 5,000 deaths per day prediction of Professor Neil Ferguson. I previously wrote how this prediction was nonsense and did not pass the smell test of plausibility. Even the best-case scenario of the Warwick model had deaths higher than the peak of last winter, despite mass vaccination and a milder variant. It does not take much education to question this, and that is what the Government did. They looked at the modelling and ignored calls for further restrictions in England, suggesting they thought SAGE was wrong again.
Reality is over 93% lower than predicted
I do not have the underlying data of the Warwick model but have recreated it by tracing the image within the report published 30 December. They predict deaths peaking in the latter part of January, around 20th to 21st. Data on deaths linked to Covid-19 come from two principal sources. First, there is data issued daily on deaths within 28 days of a positive test. Second, the Office for National Statistics publishes weekly data where Covid-19 is mentioned on the death certificate. With Omicron infecting so many people, the latter is a more reliable estimate, as the former would include someone who tests positive for Covid-19 and dies of something unrelated.
There is a time lag between a death occurring and reported, with the ONS data having a longer lag than the daily estimate. Looking at the daily estimate and tracking against the prediction, deaths in England are around 93% lower than the central estimate of the Warwick model, 88% lower than the best-case scenario and 96% lower than the worst-case scenario. Whichever way you look at it, the SAGE prediction is way off and unfit for purpose.

Conclusion
The recent SAGE model is proving yet again to be well off with deaths 93% lower than reality. Modelling is not an exact science but the recent SAGE modelling is so poor there is little credibility left to believe them. Past models have led to restrictions on lives, so accuracy and confidence in them are paramount. If you were a University lecturer assessing this recent work, the only conclusion would be a fail. The Prime Minister ignored the modelling on this occasion, but in the future, who knows what they will come up with next and will SAGE be wrong again?
✍️ Jamie Jenkins
Stats Jamie | Stats, Facts & Opinions
📲 Follow me here for more daily updates:
📢 Call to Action
If this helped cut through the noise, share it and subscribe for free now. Get my stats, facts and opinions straight to your inbox (no algorithms).