
Another nonsense Ferguson prediction - 5000 Omicron deaths a day
With the Omicron Covid-19 variant spreading across the world, Professor Neil Ferguson has suggested we could see 5,000 Omicron deaths a day unless the UK introduces tighter restrictions. So how likely is his latest prediction?
Cases vs deaths
There is a relationship between Covid-19 cases and deaths and if you track them through the pandemic, deaths peak around 14-15 days after an identified infection. I have plotted cases and deaths since last September with the deaths line moved back 14 days and set the axis so the two lines peak around the same point during the second wave.
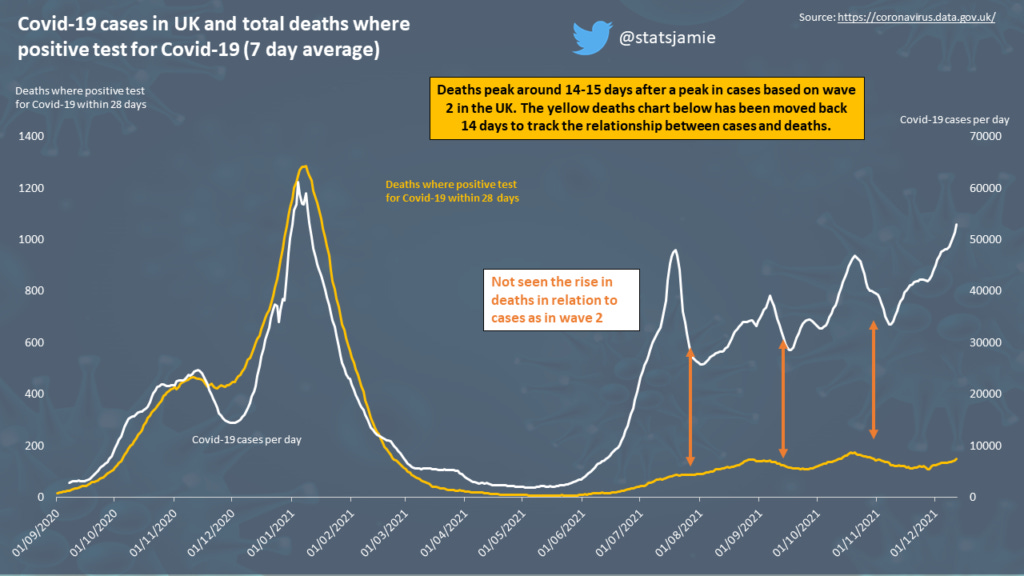
For the third wave, deaths did not increase anywhere near as high as they did previously. Several factors explain this, firstly the vaccine rollout in the UK, more people had natural immunity from prior infection, a higher proportion of cases were in younger people, and we were in the summer months.
It is good to see that the case fatality rate (deaths divided by cases) has reduced and for the last few weeks, it is around 0.28%. This means that for every 357 cases identified, there is around 1 death 14 days later. The case fatality rate differs from the infection fatality rate, with the latter being much smaller. This is because we do not identify every case in the country as many people with Covid-19 do not get tested as they have no or few symptoms. Using estimates from the ONS suggests the true number of infections is just over double what we identify in cases.
5,000 deaths per day
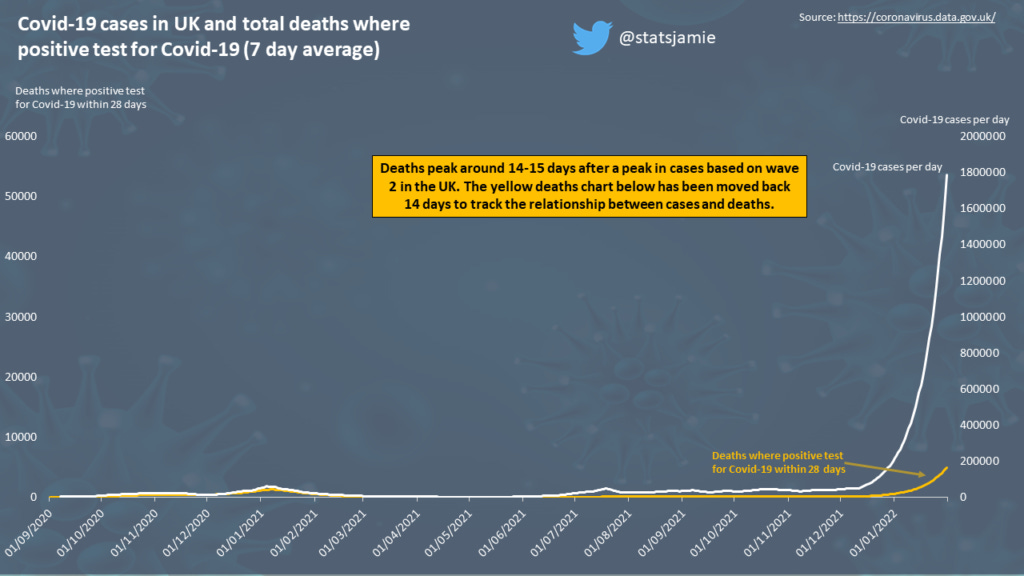
At the moment within the UK, the average rolling 7-day number of deaths is around 120 from around 43,000 cases 14 days earlier. If we assume the Omicron variant is as deadly as the Delta variant, I have plotted what would have to happen to the number of cases in the UK to arrive at 5,000 deaths per day shown in the chart below. For this to happen, the scale of increase would mean the chart of the past 21 months would be a mere blip on the chart.
Here I assume cases peak at the end of January, with deaths peaking mid-February. To get to 5,000 deaths, we would need an average of around 1.7 million cases per day at the end of January and the highest we have seen in the pandemic was on 17 December at 93,045. Therefore we need an increase in cases of 1823%.
But to get to 1.7 million cases per day, you need to see significant daily growth as it does not just happen overnight. If we assume the growth in cases is exponential, then by 31 January we would have seen around 25 million new Covid cases. So far through the pandemic, we have recorded 11.2 million, so Professor Ferguson must expect more than double the cases in the next 6 weeks than what we have identified over 21 months. Additionally, 25 million Covid-19 cases up to 31 January would actually mean 56 million infections (assuming the same rate of infections vs identified cases).
Conclusion
Various media outlets led with the 5,000 deaths a day headline unless we impose restrictions and sadly nobody checked the maths. To get to 5,000 deaths, we would need nearly 56 million infections across the population in just six weeks. We have issued 126 million vaccinations and the emerging evidence is that Omicron is less deadly (I have assumed it’s not for these calculations).
Sadly, the BBC often has this Professor on the airwaves across both their flagship TV and radio shows. If the journalists working there could smell how off the scale his numbers are, maybe they would give him a wide berth. If there is one thing Santa can do this Christmas, it is to deliver a new calculator to the Professor and for the media to stop using someone who through the headlines his numbers generate just instills unnecessary fear into the public.
Follow me over on Twitter for my daily updates.