

The past few years have put an immense strain on health services and families, with many lives ending prematurely. But as we move through 2022 and over two years since Covid-19 hit the UK, we are still seeing the fallout with more deaths than expected across some parts of society, Throughout 2022 to date, we are seeing more deaths among 30-59 year olds than we would expect, with this more pronounced in recent months. Data suggests that heart issues and diabetes are likely factors, with the Department for Health calling for an investigation due to the excess deaths in 2022.
Estimating excess deaths
The Office for National Statistics publishes registered deaths each week and compares the numbers to a five-year average of the same week. If deaths are above average, we have excess deaths. Throughout 2020 and 2021, they used the 2015/19 period as the comparator, but in 2022 changed to compare to 2016/19 and 2021, so excluded 2020. As we saw abnormally high death rates in the first quarter of 2021, many analysts, including myself, continued to use 2015/19 for the average.
Deaths for most weeks across the past 3-months at least 10% above average
For many weeks over the past 3 months, we have seen total deaths over 10% above the 2015/19 average. Last week I looked at this breakdown by age group, comparing deaths in each five-year age group in 2022 vs the 2015/19 average. One standout number was that across 2022, for children aged 10 to 14, deaths are around 11.7% higher than average, with double-digit percentages above average across several other age groups.
While the number of deaths among children is low, any excess is a concern. So I have looked at the method of comparing numbers to previous years and identified a deficiency. Over the period 2015/19, there were 3.3 million children aged 10-14, and we saw 297 deaths, so around 9 children in every 100,000 died. While we don’t yet have population estimates for 2022, the ONS estimates the population by moving previous years forward, and this would suggest that in 2022 we have around 3.8 million children aged 10-14, 500,000 more. So even if the likelihood of a child dying was the same as pre-pandemic, we would see more deaths, because there are more of them.
More people in older age groups means we would expect 880 more deaths per week in 2022 than in 2015/19
To overcome changing population structure, I have calculated death rates by age group and sex over the period 2015/19 and applied them to the 2022 population to estimate expected deaths.
Across the years 2015/19, there were 531,214 deaths on average per year, and applying death rates from this period to the 2022 population profile, we would expect to see 577,000 deaths, around 46,000 more, or 880 per week. This is because people are more likely to die as they get older, and the population is on average older. The white and black lines in the chart below show the expected deaths each week and average deaths across 2015/19.
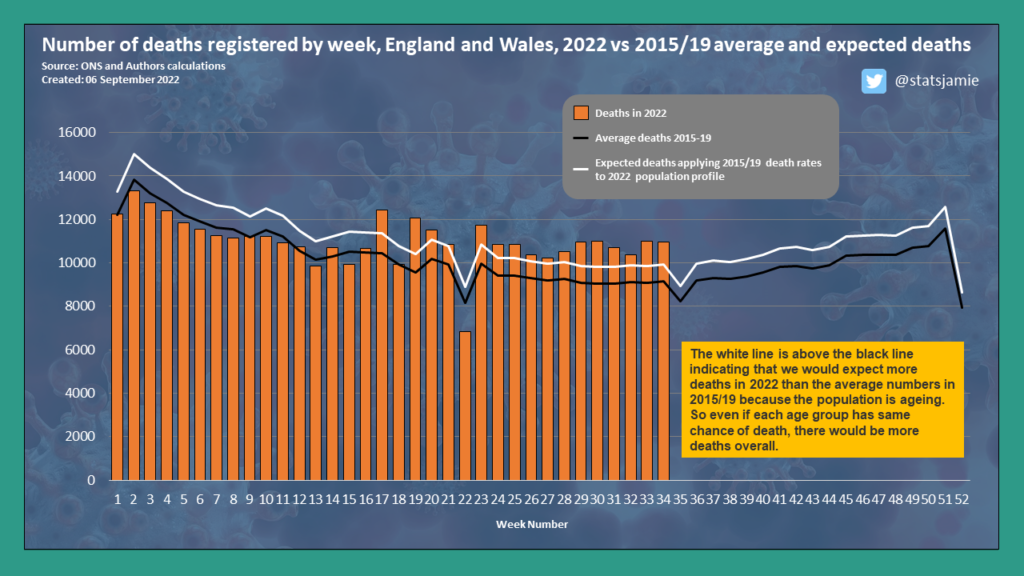
Comparing deaths in 2022 (orange bar in the chart) to the expected deaths (white line) shows that actual deaths were below expected deaths for most of the year, until around week 19. Then, for the past three months, actual deaths in 2022 are above what we would expect if death rates remained the same as pre-pandemic, The deaths above expectation coincide with record ambulance callouts and waits at A&E services.
Deaths above expectation throughout 2022 for those aged 30 to 59
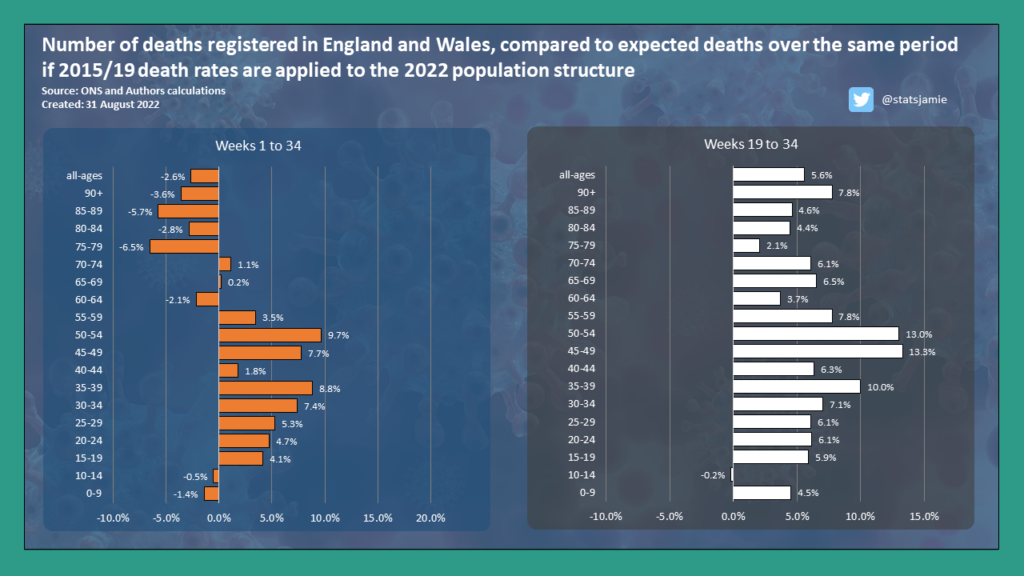
If we look across the different age groups, for the older age groups, 60 and over, deaths have generally been below what we would expect across 2022 (up to week 34), but above expectation the past few months. Below expected deaths is not surprising as we know Covid is a virus that disproportionately kills those at older ages, so it is likely there has been some mortality displacement, with some people who may have died in 2022 losing their life in 2020 and 2021. The more recent numbers since week 19 above average for older people coincide with the wave of Covid for the Omicron sub-variants BA.4 and BA.5.
While deaths linked to Covid-19 are far less likely among people under the age of 60, they do occur. But when stripping out deaths linked to Covid-19, it is concerning we are seeing deaths above expectation among those aged 30 to 59 throughout 2022. The deaths above expectation are more pronounced since week 19.
Heart issues and diabetes linked to higher-than-expected deaths
Naturally, a question that arises when looking at these deaths is about their cause. The ONS weekly publication gives little information on the cause but the Office for Health Improvement and Disparities (OHID) has a dashboard for England that gives some information. In addition, the ONS publishes monthly the top causes of death and compares them to the five-year average.
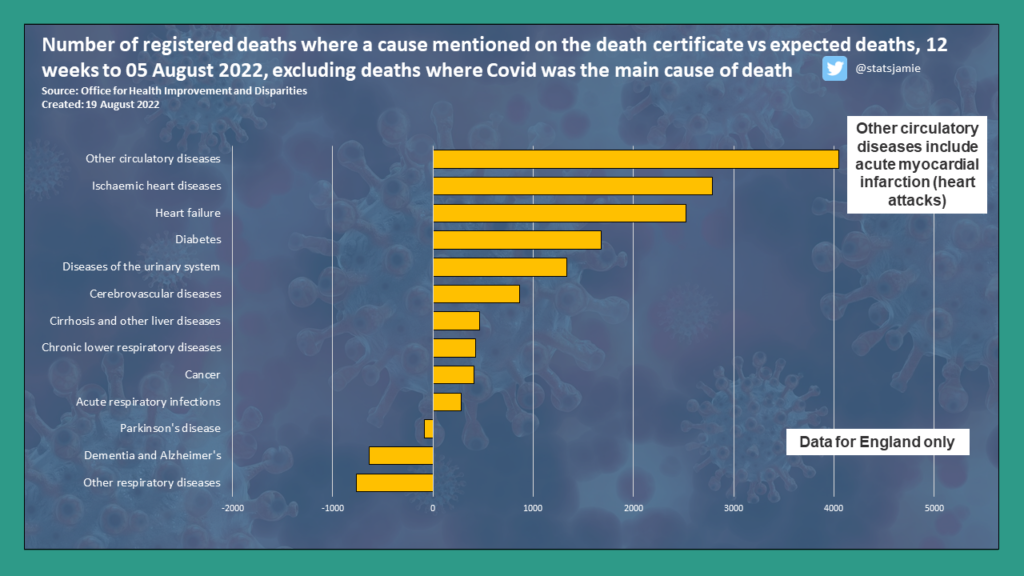
Focusing on the OHID dashboard and removing deaths where Covid was the underlying cause indicates higher than expected deaths linked to circulatory diseases, which include conditions such as acute myocardial infarction, commonly known as a heart attack as well as heart disease and heart failure. Diabetes is another cause mentioned on death certificates that is towards the top of higher-than-expected deaths. The data is not broken down by age group and cause, but it does give an indication of the types of causes across the age groups.
The latest ONS monthly mortality figures for June show that when adjusting for age and comparing to the five-year average, among the top 10 causes of death, the only cause where there was a statistically higher rate of death was ‘Symptoms, signs, and ill-defined conditions’. This is where there is no known diagnosis, so the cause is unknown.
Conclusion
Without access to patients’ medical records and knowledge of previous Covid-19 infection and/or vaccination status, it is impossible for me to give a definitive answer as to the specific factor leading to higher than expected deaths across some age groups. With the NHS cutting back on non-Covid services throughout the pandemic and individuals’ lifestyles affected, for example, increasing alcohol consumption, and putting on weight, this will no doubt play a factor.
Many patients being in a hospital fit to discharge, but unable to leave because of factors that include not having the care in the community does not help the current pressures on A&E. Bed blockages result in ambulances being stuck outside emergency departments waiting to offload patients, taking them out of action for new emergency calls. Some patients are also turning up at A&E because of difficulties in getting a GP appointment, putting an additional strain on emergency services.
Across the country, we have embarked on a widespread vaccination program related to the Covid-19 pandemic, with around 47.7 million people in England and Wales receiving at least one dose. While most people have no issues following a vaccine, we know that some have had adverse reactions, and sometimes this has led to death. In addition, while most people who get a Covid-19 infection recover with no issues, some studies suggest a Covid-19 infection itself can cause cardiovascular issues post-infection.
It is likely there is a combination of factors that help explain the numbers presented above, which warrants further investigation, which the Department for Health has called for.
* Charts updated on 06/09/22 to include data up to week 34.
Follow me over on Twitter, Instagram, Facebook, Tik Tok, or Gettr for my daily updates, or read my recent blog looking at how banning Novak Jokovic from the US Open is not scientific.