
How the “Super Flu” Narrative Fell Apart Once the Numbers Came In
UKHSA data shows an early December peak — and severity nowhere near recent bad seasons.

In December, Britain got the full COVID-era treatment again.
Crisis language. Wall-to-wall coverage. A familiar moral pressure: get vaccinated, do your bit, be worried. And—right on cue—the behavioural script starts creeping back in: masks, even in classrooms.
It felt like someone pressed rewind to 2020.
But it’s now late January. UKHSA has published enough surveillance data to check the rhetoric against reality.
So let’s do what much of the media didn’t: look at what actually happened.
🗞️ The scare started weeks earlier
Before the December panic really kicked off, the “worst season” framing was already being seeded.

In that coverage, the BBC reported that the NHS had issued a “flu jab SOS” amid fears of a “brutal winter,” and stressed that while there was “nuance and uncertainty,” leading experts said they “would not be shocked” if it became the worst flu season in a decade.
One quoted expert, Prof Nicola Lewis (World Influenza Centre, Francis Crick Institute), described the season as unusual — “We haven’t seen a virus like this for a while… these dynamics are unusual” — adding “I’m not panicking, but I am worried.”
This matters because it shows the alarm narrative didn’t begin in December. The tone was being set weeks earlier — long before we could see where the season would actually peak.
🚨 The December panic
In early December, health messaging shifted into full crisis mode.
NHS England warned it was facing a “worst case scenario” with 2,660 flu patients per day in hospital beds — described as “the highest ever for this time of year,” up 55% week-on-week, with references to flu beds “filling multiple whole hospital trusts.”
And crucially, Professor Meghana Pandit warned: “the peak is not in sight yet”, and the NHS faced an extremely challenging few weeks ahead.
Health Secretary Wes Streeting went further, describing a “tidal wave” of flu.
That messaging was then repeated across the media ecosystem, often framed as an unprecedented “super flu” moment, despite “super flu” not being a scientific term.
So here’s the test: Was the data actually consistent with the tone?
📊 What the data shows
A month on, we’re no longer guessing. We’ve now got enough UKHSA surveillance data to judge the “super flu” rhetoric against what actually happened on the ground.
Three metrics matter here:
Test positivity (how much flu is circulating)
Hospital admissions (pressure on hospitals)
ICU/HDU admissions (severity — how many people became seriously ill)
Let’s look at them in turn.
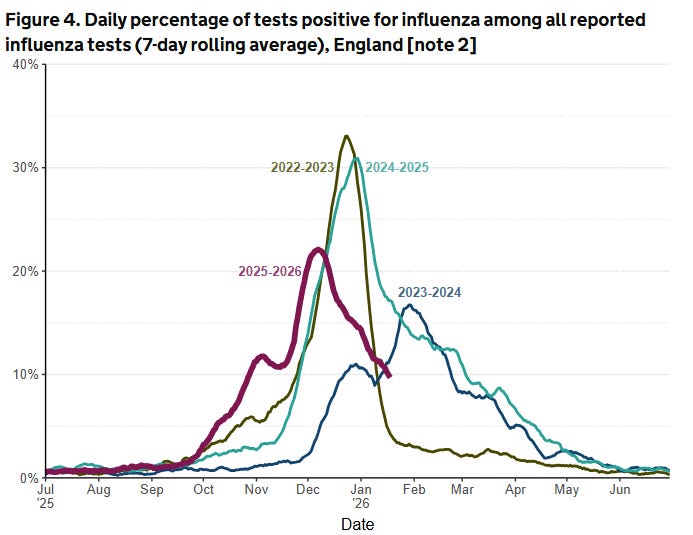
🧪 1) Influenza test positivity: the peak was early December
First, the cleanest “is flu rising or falling?” signal: the daily percentage of tests positive for influenza (7-day rolling average).
This chart shows the 2025/26 wave rose through autumn, then peaked in early December — and crucially, began falling shortly after. In other words, the wave reached its high point around the week ending 7 December, then started to unwind into January. It also peaked lower than recent heavy seasons (notably 2022/23 and 2024/25), which is exactly why the “worst in a decade” framing doesn’t stand up when you put it in context.
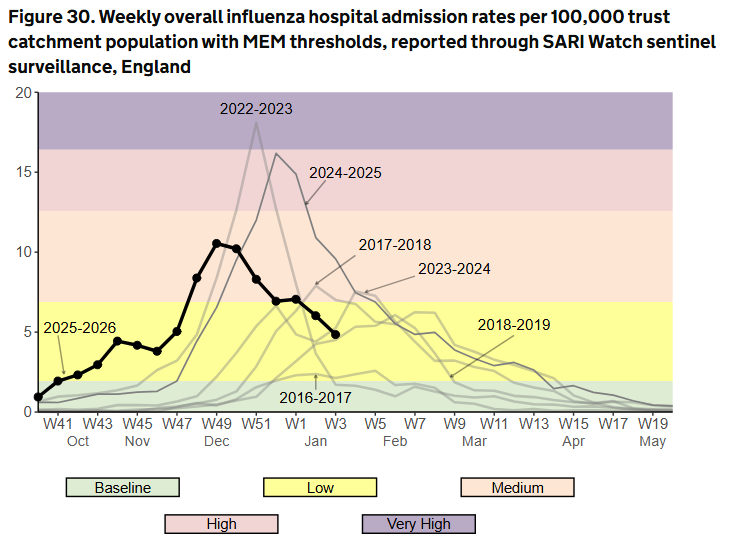
🏥 2) Hospital admissions: pressure peaked in the same window
Next: hospital admissions for influenza (weekly admission rate per 100,000 trust catchment population).
To be fair, when the December headlines were flying around, admissions were still moving upward, and nobody had the benefit of hindsight. That’s exactly why uncertainty and careful language matter.
But what the full UKHSA series shows now is that the 2025/26 season peaked in early December (around weeks 49–50) and then declined into January. And crucially, even at its peak, the admissions rate was not exceptional by recent standards — it sits below the genuinely heavy seasons shown on the same chart, particularly 2022/23 and 2024/25. So the honest summary is: real winter pressure, early peak — but not an unprecedented “super flu” season.
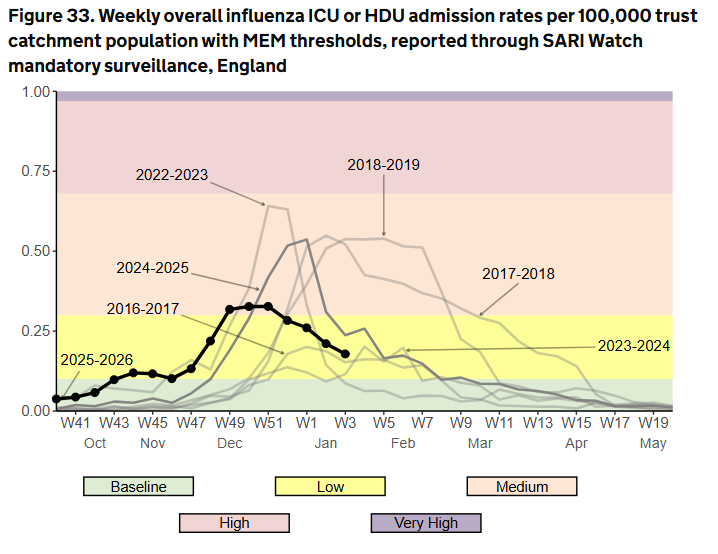
🏥⚕️ 3) ICU/HDU admissions: severity stayed in the “Low” band
Finally, the most important severity signal: ICU/HDU admission rates (per 100,000), reported through UKHSA’s mandatory surveillance.
This is where the “overwhelmed” narrative either holds up, or it doesn’t. The chart shows ICU/HDU rose into early-to-mid December and briefly touched the “medium” band, but only at the very lowest end of that range — and then it fell back again. More importantly, the 2025/26 peak is nowhere near what we’ve seen in recent severe seasons: the curve sits well below 2022/23, and below other notable peaks in the last decade.
So yes: there was a short-lived rise in critical care demand — but it remained modest, and it does not support “worst season in a decade” and “super-flu” framing.
📺 Back to 2020: the media-mask reflex returns
The most revealing part wasn’t just the rhetoric — it was how quickly the country snapped back into COVID habits.
While the flu curve was already rolling over, the country’s media reflex snapped straight back into COVID mode: urgency, alarm, and pressure for visible interventions.
That’s exactly what I covered in my earlier post:

On ITV’s Good Morning Britain, Kate Garraway repeatedly pressed the Schools Minister on masks in schools — first “Are you considering face masks in school?” then pushing “Why not have face masks in school?”
That framing matters. It treats masking children as the obvious default — and forces the minister to justify not pulling the lever.
And that’s the deeper problem: when respiratory illness rises, the default response becomes fear-first messaging and pressure for visible interventions, rather than calm, contextualised, evidence-based communication.
🧠 The point: facts over fear
Let’s be clear: flu is real, and winter pressure is real. Hospitals can be under genuine strain even during a moderate season because the system is fragile — bed capacity, discharge bottlenecks, staffing, a mix of respiratory viruses, everything.
But that’s exactly why communication has to be disciplined.
If institutions and broadcasters frame every winter as an apocalypse, they burn public trust for the moment when something genuinely unusual arrives.
And if the default response to seasonal illness is “mask the kids”, we’ve learned nothing from the last five years.
This wasn’t “super flu”. It was an early flu wave that:
peaked in early December,
fell for weeks into January,
and sat below the truly bad seasons on admissions and ICU severity.
The story wasn’t data-driven risk communication. It was crisis messaging first — context later (if at all).
✍️ Jamie Jenkins
Stats Jamie | Stats, Facts & Opinions
📢 Call to Action
If this helped cut through the noise, share it and subscribe free at statsjamie.co.uk — get the stats before the spin, straight to your inbox (no algorithms).
📚 If you found this useful, you might also want to read:

📲 Follow me here for more daily updates:
There was a suggestion that the sudden rise in case at the beginning of December occurred when they started giving children Live/attenuated Vaccine through a nasal spray and this caused a rise in cases in adults. I don't know if that's true or not, it was just what I read.
I first saw you on MG show on Talk and now on his own show which is even better. I am glad as a Statistician you are making numbers real again. I was going to say fun but that’s stretching it I fear for most. The attempt to have a panic about flu before Christmas is a reminder of just how easily the State can manipulate. Press those fear buttons.