

Some statistics quietly tell you a country is changing.
The latest births data from the Office for National Statistics is one of them.
In 2025, there were 585,396 live births in England and Wales, down 1.6% from 594,677 in 2024. The provisional total fertility rate fell from 1.41 to 1.39 children per woman. In plain English, the fertility rate is the average number of children women are expected to have over their lifetime if current patterns continue.
A population normally needs a fertility rate of around 2.1 children per woman to replace itself naturally over time, before migration is taken into account. At 1.39, England and Wales are nowhere near that level.
But the deeper story is not simply that births are falling. It is that the country being born is changing.
Britain Is Not Replacing Itself
A fertility rate of 1.39 children per woman is not just a statistic. It is a warning about the future.
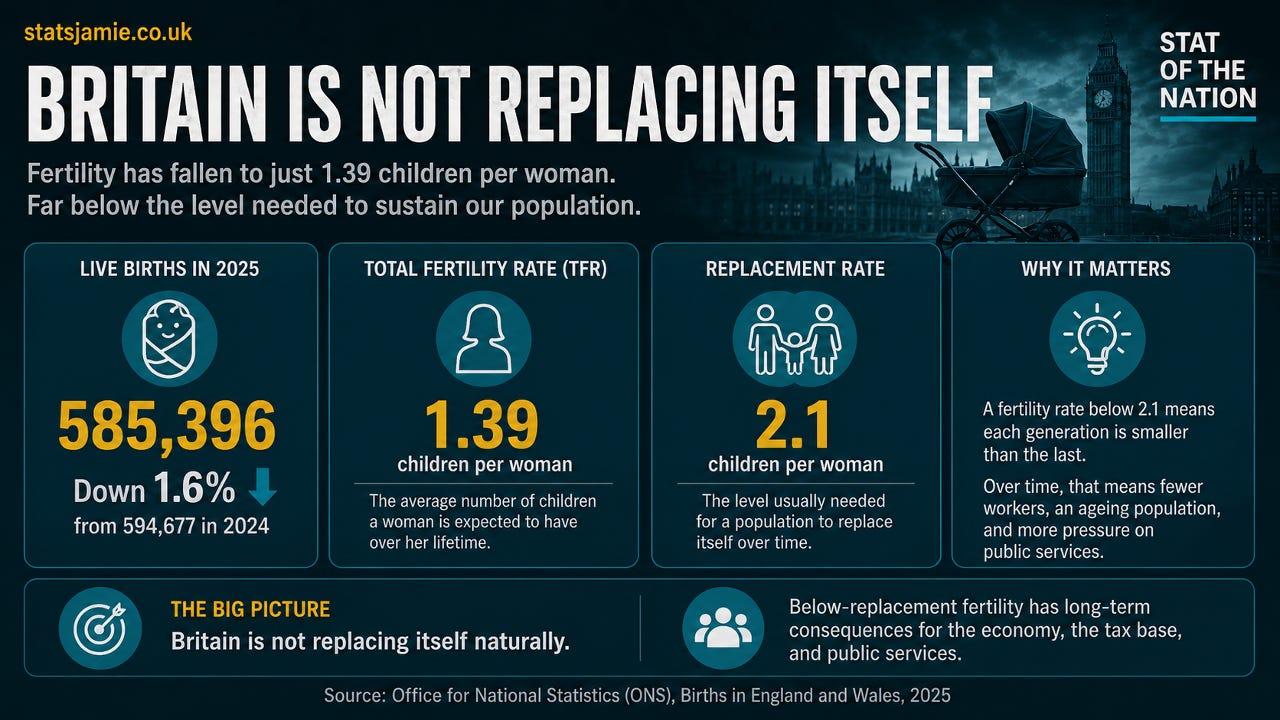
Fewer babies today means fewer workers tomorrow. Fewer workers means more pressure on the tax base, pensions, the NHS, social care and the working-age population expected to fund it all. Politicians can talk endlessly about growth, productivity, public services and debt, but underneath it all sits a basic demographic question: who is going to pay for the country in 20 or 30 years’ time?
Britain is not producing enough children to sustain itself naturally over the long term. Migration can change the population picture, but that means the future is increasingly shaped by who comes here, who settles here, and who has children here.
More Than 4 In 10 Births Now Involve A Parent Born Abroad
The ONS says the share of live births where one or both parents were born outside the UK increased from 39.5% in 2024 to 40.2% in 2025.
Behind that headline figure, the breakdown is even more revealing.
In 2025, 160,016 births were to two non-UK-born parents. Another 37,465 were to a non-UK-born mother and UK-born father, while 32,653 were to a UK-born mother and non-UK-born father.
Only 330,040 births were recorded as being to two UK-born parents, equal to 56.4% of all births.
That is a powerful demographic marker. It does not mean those children are “foreign” — they are children born in England and Wales. But it does show how much of the next generation is now being shaped by migration and by the children of migrants.
This is how a country changes without most people noticing — not in one dramatic moment, but birth certificate by birth certificate.
The Births Story Is Now A Migration Story
The country-of-birth data shows that births to UK-born mothers fell again in 2025, while births to non-UK-born mothers rose slightly.
There were 382,732 births to UK-born mothers, down from 392,984 in 2024. There were 202,612 births to non-UK-born mothers, up slightly from 201,660. Non-UK-born mothers accounted for 34.6% of all live births.
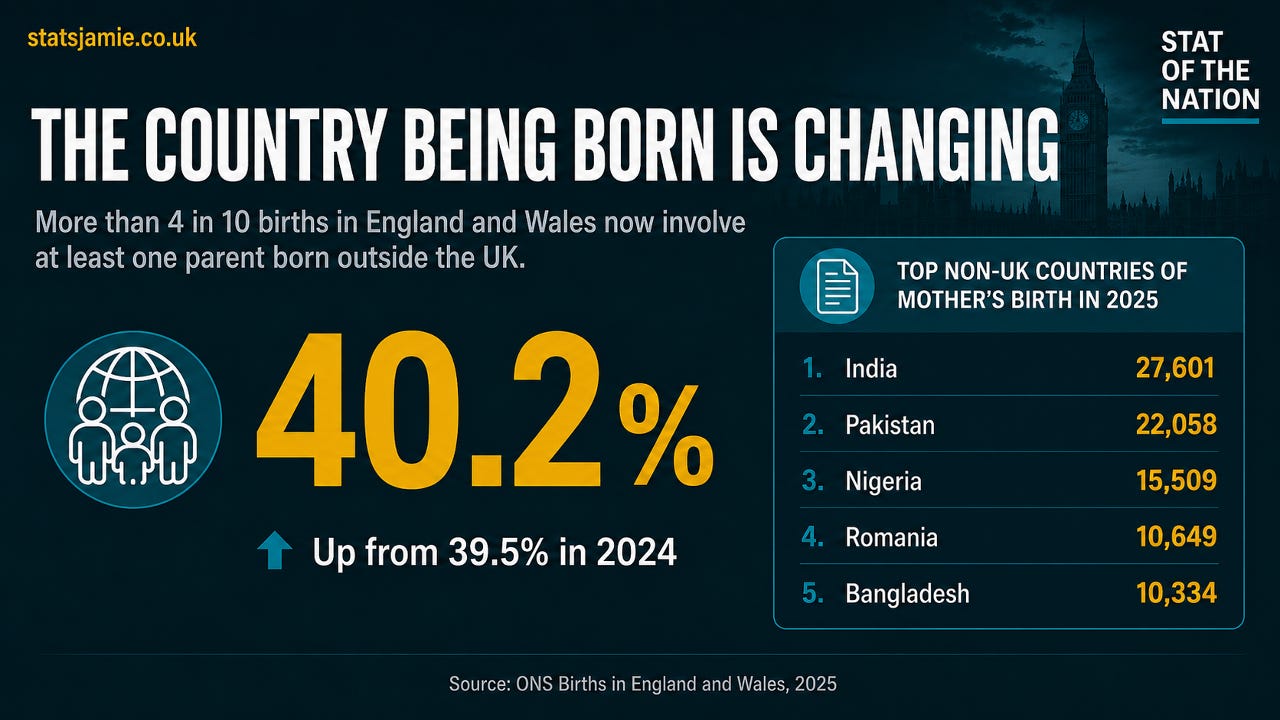
The top non-UK countries of birth for mothers were:
India: 27,601 births
Pakistan: 22,058 births
Nigeria: 15,509 births
Romania: 10,649 births
Bangladesh: 10,334 births
This matters because the migration story has changed. It is no longer mainly an Eastern Europe story. Romania and Poland are falling from their earlier peaks, while the bigger growth is increasingly linked to South Asia, Africa and parts of the Middle East.
Overall births are falling, but they are not falling evenly.
The Pressures Are Not Spread Evenly
The latest detailed fertility breakdown by mother’s country of birth is for 2021, not 2025, so it should not be treated as the exact fertility pattern today. But it does show how fertility differed between groups.
In 2021, the total fertility rate was 1.49 for UK-born mothers and 1.68 for non-UK-born mothers overall. Within that, the differences were much larger: Pakistan 2.92, Bangladesh 2.71, Afghanistan 3.09, Iraq 3.15, and Nigeria 2.15. By contrast, mothers born in Poland had a TFR of 1.28.
So this is not a simple story of “foreign-born mothers have high fertility”. Some groups are much higher, some are closer to the average, and some are lower. But the pattern matters: some of the groups contributing large numbers of births also had fertility rates above the UK-born rate.
Country of birth is not the same as ethnicity, and it should not be treated as if it tells us everything about identity, nationality or integration. But if different communities have different fertility rates over time, then the ethnic, cultural and religious profile of the next generation changes. That is not a conspiracy theory. It is arithmetic.
It also has practical consequences. Children need public services long before they become future taxpayers: maternity care, health visitors, GP appointments, nursery places, school places, teachers, SEND support where needed, housing and local services. Families may also be eligible for Child Benefit and other forms of support.
That is true of all children. But if births are increasingly concentrated among groups with higher fertility, and if those groups are more concentrated in particular towns, cities or local authorities, then pressure on the state is not evenly distributed either. It shows up in schools, NHS maternity demand, housing need, local authority budgets and the welfare system.
This is not about blaming children. Children born here are part of Britain’s future. But a serious country should be able to say something obvious: birth patterns shape the future population, and population change has costs, pressures and trade-offs.
Britain’s Demographic Vicious Circle
The question is not just why some communities are still having children. The bigger question is why so many others feel they cannot afford to.
For many young people in Britain, the economics of starting a family have become brutal. Homes are too expensive, rents are too high, mortgages are harder to afford, childcare can feel like a second mortgage, and wages have not kept up with the cost of building a stable family life.
So people delay children. Then they have fewer children. Or they do not have children at all. That is how a country ends up with a fertility rate of 1.39.
Once domestic fertility falls this low, the state has a choice: accept population ageing and decline, make it easier for its own citizens to start families, or rely increasingly on migration to sustain population growth.
Britain has drifted into the third option without ever having an honest national debate. But that creates a vicious circle.
If young people cannot afford homes, childcare and family life, they have fewer children. Government then leans on migration to keep the population and workforce growing. But without enough new housing and infrastructure, more people means more pressure on rents, house prices, schools, GP surgeries and local services.
That makes starting a family even harder for the next generation.
So Britain ends up using migration to compensate for a fertility crisis, while the pressure created by population growth helps make that fertility crisis worse.
The 2025 births data tells a clear story: births are falling, fertility is falling, parents are getting older, and more than 4 in 10 births now involve at least one parent born outside the UK. The next generation is being shaped increasingly by migration, while many UK-born families appear to be having fewer children than they might have wanted in a more affordable country.
If that is the model politicians want, they should be honest about it. If it is not, they need to explain why Britain has become such a difficult place for its own young people to start a family.
Because no serious country can build its future on low fertility, unaffordable family life, rising population pressure, and a migration policy nobody wants to debate honestly.
✍️ Jamie Jenkins
Stats Jamie | Stats, Facts & Opinions
📢 Call to Action
If this helped cut through the noise, share it and subscribe free by entering your email in the box below and get the stats before the spin, straight to your inbox (no algorithms).
📚 If you found this useful, you might also want to read:
Starmer’s Big Answer Is More Europe — No Wonder Voters Are Walking Away

Keir Starmer stood up yesterday to save his premiership. What he delivered was a speech that showed exactly why it is collapsing.
📲 Follow me here for more daily updates:
It would be interesting to know how many of the mothers are in receipt of benefits before the birth wouldn't it? I suspect quite a few of the 4 in 10 births are to women already on benefits. If that's the case then they aren't exactly going to be paying future taxes! So the native Briton who works and pays taxes, doesn't get state benefits and can't afford to have children would be hit even more by having to support women with babies who live off the state. Didn't they used to say that only the very rich and the very poor had numerous children? One class was wealthy enough and the other, these days, gets the benefits
Lots of worthy research but "Fewer workers means more pressure on the tax base, pensions, the NHS, social care and the working-age population expected to fund it all." is clearly not true when the central banks themselves are making it plainer than ever that national currencies originate from them. Witness this recent statement from the ECB; "Fiat money is declared legal tender and issued by a central bank. It can’t be directly converted into, for example, gold... Our euro can take the form of banknotes and coins, but it can also exist in a bank account as a computer entry or be stored in a savings account." (https://www.ecb.europa.eu/ecb-and-you/explainers/tell-me-more/html/what_is_money.en.html) Nothing there about needing to get it from taxpayers first and why oh why would anyone think there ought to be? It's blindingly obvious money doesn't originate with taxpayers begging the question so few are asking; where does money actually come from then for taxpayers to be able to get hold of it at all? The ECB have helpfully laid out a broad overview but the Bank of England had already gone into specifics about this in their March 2014 Quarterly Bulletin where their video explains banks create new money when they loan it and their PDF explains that what we use for money is Govt. IOUs (https://www.bankofengland.co.uk/quarterly-bulletin/2014/q1/money-creation-in-the-modern-economy)
It's obvious from that alone that Govt's self-funding. If anyone wants to know the more intricate details (gets wonkish!) they can start here https://www.economania.co.uk/various-authors/where-money-comes-from.htm
In closing, I'd like to say IMO those who clandestinely rule over us don't care what colour we are; Their sole interest is that there are warm bodies available to be sent down their mines and up their chimneys.