
Payroll Jobs Keep Falling: Labour’s Jobs Tax is Biting
Ten payroll drops in a year, six in a row since Labour took office — fewer jobs, less tax, and more borrowing to plug the gap.

You can feel it, can’t you?
Fewer jobs in the market. More “sorry, we’re not hiring” signs. Your son’s mate can’t find a summer job. Your local café has cut staff hours. And yet, the government tells you their plan is “working.”
The latest ONS/HMRC payroll data proves what you already suspect — Britain is bleeding jobs, and Labour’s “jobs tax” is making it worse.
The latest payroll numbers
July 2025’s official figures paint a grim picture:
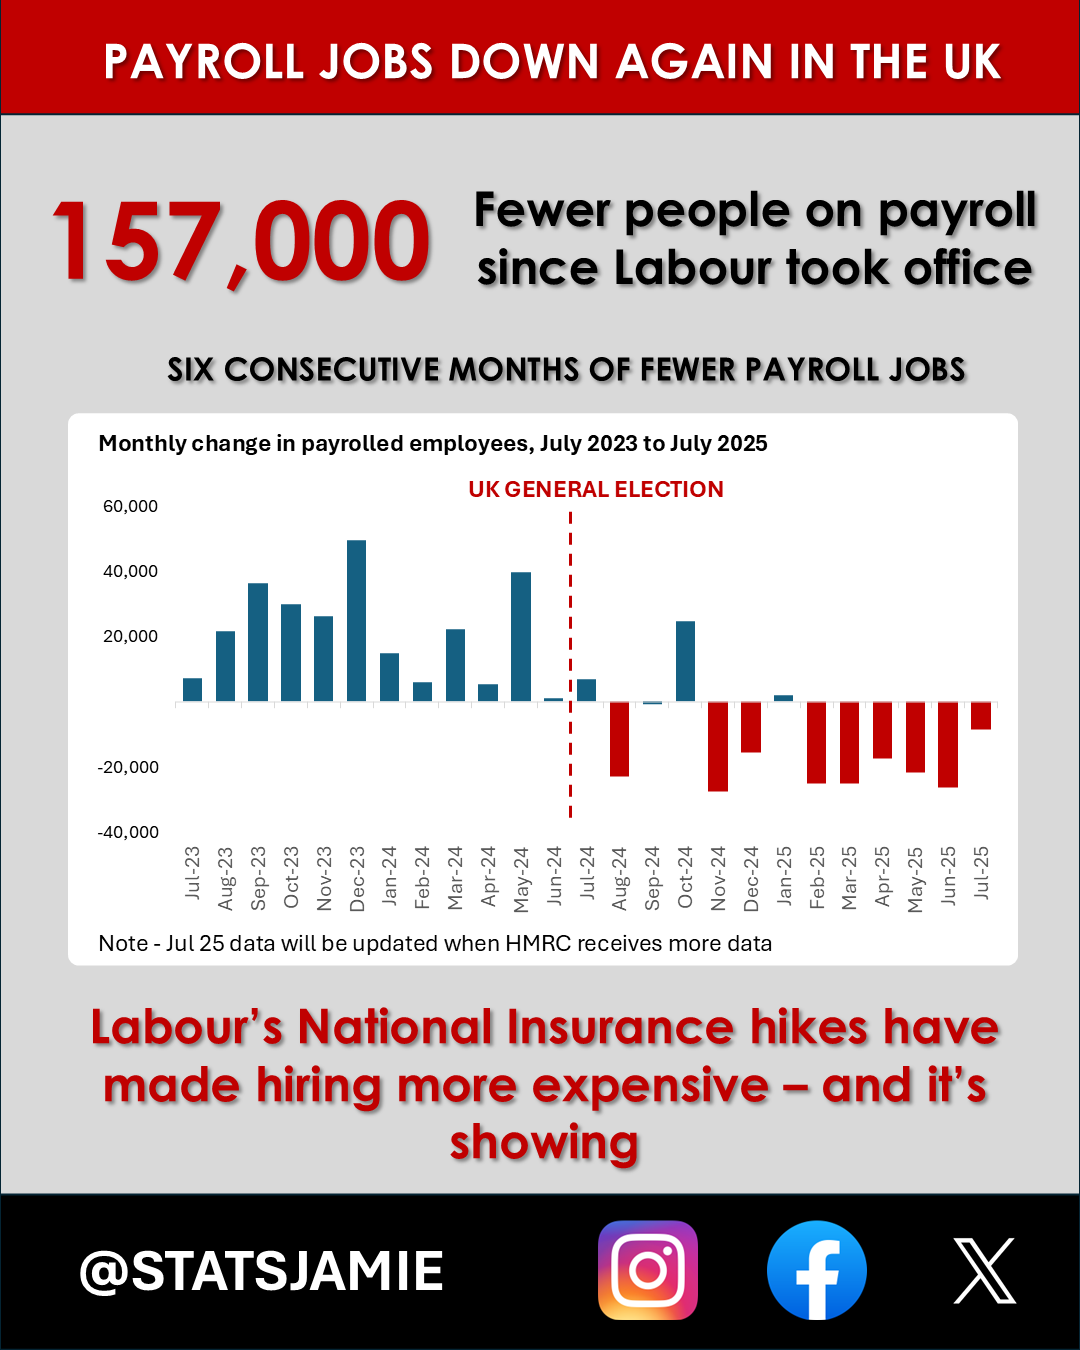
157,000 fewer people are on payroll since Labour took office.
Payrolls have fallen every single month — six months in a row.
There have been 10 separate monthly falls in the past 12 months — showing this isn’t a short-term blip.
Compared to July 2024, there are 164,000 fewer payrolled employees — a 0.5% drop year-on-year.
And here’s the part no one in government wants to talk about: fewer people on payroll doesn’t just mean more people out of work — it means less tax coming in to fund public services. When the tax base shrinks, you either cut spending or borrow more. Under Labour, the answer seems to be: borrow more.
Sectors hit hardest
The sector taking the biggest hammering? Accommodation & food services — down 108,000 jobs in the past year. That’s pubs, cafés, restaurants, hotels — the businesses most exposed to rising costs.
Other sectors in decline include retail and manufacturing.
The only major sector gaining jobs is health & social work — up 67,000. But that’s the public sector. And the public sector doesn’t pay for itself — it’s funded by taxes from the private sector. If private-sector payrolls keep falling, that extra cost can only be met through higher taxes or more borrowing. Labour seems perfectly comfortable with the latter.
Regions and demographics
The damage isn’t evenly spread:
London is worst hit, with a 1.0% fall in jobs year-on-year.
All regions except Northern Ireland are down.
Young people are suffering most — 102,000 fewer under-25s on payroll compared with last year.
This matters. These are the workers who form the pipeline for future growth — if they’re locked out now, the economy suffers for years.
Why it’s happening: the jobs tax
Labour’s decision to hike employers’ National Insurance contributions was a gut punch to hiring.
When you make employing people more expensive, employers react in predictable ways:
Freeze recruitment
Cut hours
Lay people off
And the sectors most reliant on lower-to-mid wage staff — hospitality, retail, manufacturing — are the ones taking the hit first.
Vacancies drying up
It’s not just existing jobs being cut — new opportunities are disappearing too.
The number of job vacancies in the UK fell by 44,000 (5.8%) in the quarter to 718,000 (May to July 2025). This is the 37th consecutive quarterly fall in vacancies, with 16 of the 18 industry sectors posting declines.
Compared with a year ago, total vacancies are down 145,000 (16.8%) — and they’re 77,000 (9.7%) below pre-COVID levels.
Competition for the remaining jobs is getting tougher. There are now 2.3 unemployed people for every vacancy, up from 2.1 in the previous quarter. That’s more people chasing fewer roles — and it’s hitting young and lower-skilled workers hardest.
The GDP connection
Jobs aren’t the only thing shrinking. The wider economy is also slipping:
GDP fell 0.1% in May 2025, after a 0.3% drop in April.
Two straight months of decline alongside falling payroll numbers is a clear warning sign the economy is heading in the wrong direction.
The big picture
Labour inherited an economy that needed stability and growth. Instead, they:
Increased employer costs through a jobs tax
Ignored the strain on key sectors
Oversaw 10 falls in payroll jobs in the past 12 months, including six in a row since taking office
The result?
Falling GDP. Falling jobs. Rising costs. Less tax revenue to fund public services — and more borrowing to cover the gap.
The numbers don’t lie — Britain’s economy is struggling right before our eyes.
📊 For more breakdowns of the official stats without the spin, subscribe to Stat of the Nation today.
that one graph of before and post election communicates so much