

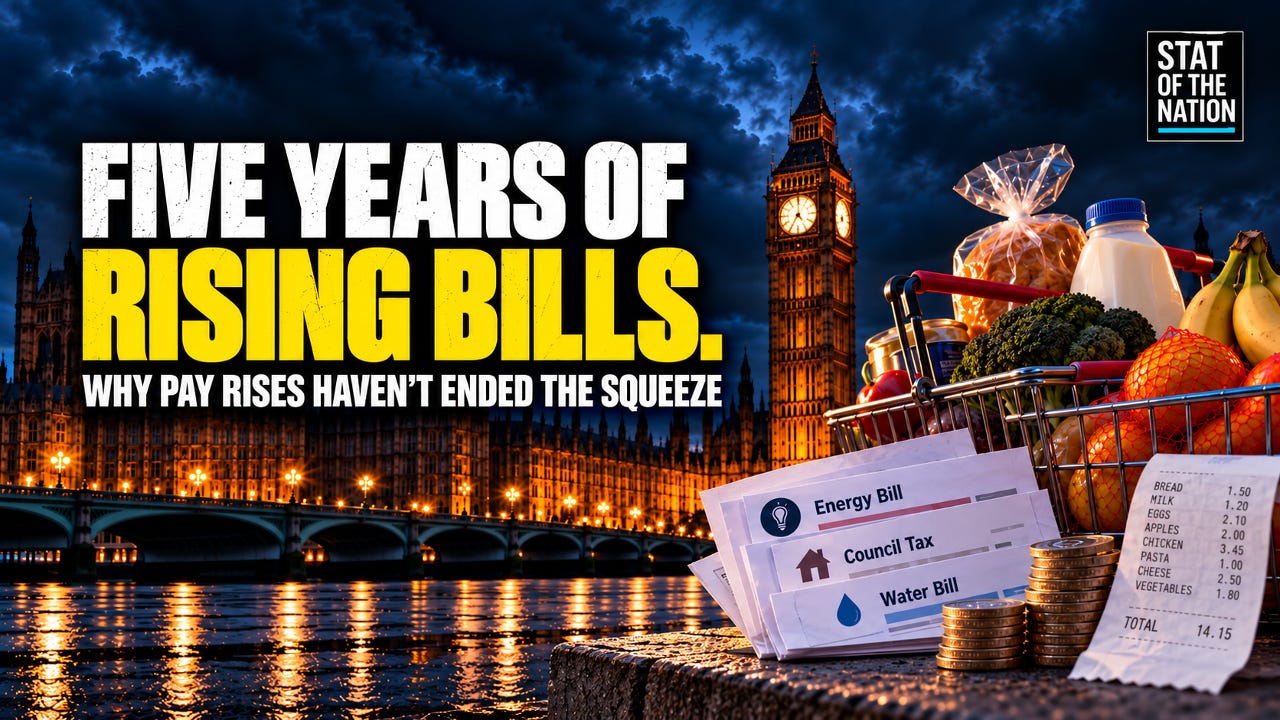
Almost £6,400 a year. That’s how much more an illustrative renting household could now be paying for food, energy, rent and petrol compared with five years ago.
That’s an additional £533 every month, simply to cover the increased cost of everyday essentials.
I’ve analysed five years of official statistics, comparing August 2021 with August 2026, to understand how much the cost of living has changed.
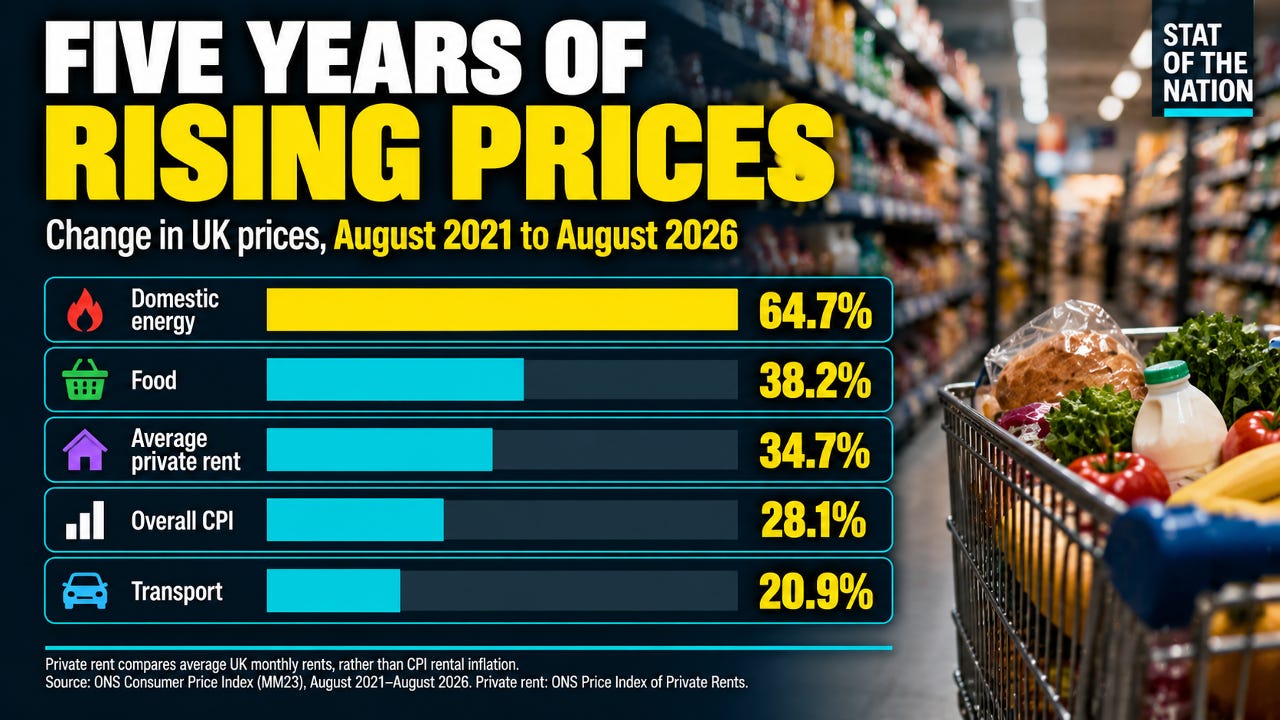
The findings are striking. Domestic energy prices have increased by 64.7%, food by 38.2%, average private rents by 34.7%, and transport by 20.9%.
Overall consumer prices increased by 28.1% over the same period.
While inflation has slowed considerably from its peak, most prices haven’t returned to their previous levels.
Where does the additional £6,400 come from?
My calculation combines four annual costs:
Food: £1,192 extra, based on a £60 weekly shop in 2021.
Gas and electricity: £685 extra, using identical energy consumption.
Rent: £4,332 extra, comparing average UK private rents.
Petrol: £190 extra, based on a driver covering 6,200 miles annually.
Together, these amount to approximately £6,400 more every year.
This is an illustrative household, rather than an official estimate of the national average. But it demonstrates how rising essential costs can quickly add up to thousands of pounds.
Food: Nearly 40% More Expensive
Perhaps nowhere is the increase in everyday costs more obvious than in the supermarket.
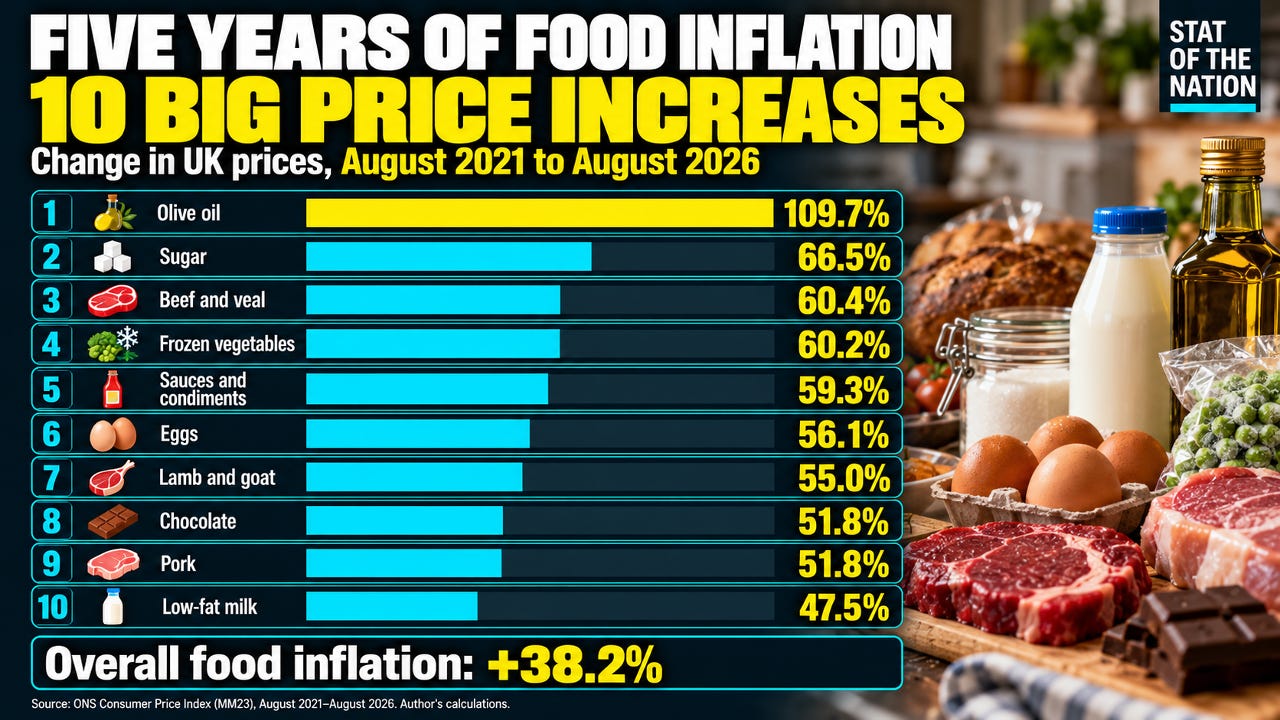
My analysis of the ONS Consumer Price Index shows that food prices increased by 38.2% between August 2021 and August 2026.
A basket of groceries costing £100 five years ago would now cost approximately £138.
But some everyday foods have increased considerably faster.
Olive oil has more than doubled in price, increasing by 109.7%. Sugar is up 66.5%, beef and veal 60.4%, and eggs 56.1%.
Even low-fat milk has risen by nearly 48%, while bread is approximately 30% more expensive.
For a household spending £60 a week on groceries five years ago, maintaining the same shopping basket would now cost almost £83.
That’s approximately £1,200 extra every year, without buying any more food.
For a larger household previously spending £100 a week, the additional cost approaches £2,000 annually.
Families have responded by switching supermarkets, choosing cheaper products and cutting back on purchases.
For many households, the reality is that they’re paying more while consuming less.
Energy: Nearly £700 More for the Same Usage
Domestic energy has experienced some of the largest increases of the past five years.
According to the ONS, gas prices have risen 88.3%, electricity 46.4%, and domestic energy prices overall 64.7% since August 2021.
Prices surged during 2022 and early 2023 before falling back from their peak. Despite those reductions, they remain substantially higher than five years ago.
Using identical annual consumption in both periods, based on Ofgem’s current typical-use assumptions, I’ve calculated that an annual gas and electricity bill increased from approximately £979 in August 2021 to £1,664 in August 2026.
That’s an additional £685 a year, or £57 every month, without using any more energy.
And prices increased again in October, taking the Ofgem price cap to £1,723 for typical annual consumption.
Households have also reduced their energy use, partly because higher bills have forced families to cut back on heating their homes.
Energy-efficiency improvements have contributed, but affordability has been an important factor.
For many, higher bills have meant paying more for energy while using less of it.
Housing: Another £4,300 a Year in Rent
Housing represents one of the largest expenses most households face.
The latest ONS private rental statistics show that average UK private rents increased from approximately £1,039 a month in August 2021 to £1,400 in August 2026.
That’s an increase of 34.7%, or £361 a month.
Over a year, the difference amounts to £4,332.
These figures compare national average rents at two points in time, rather than the increase experienced by individual tenants. Nevertheless, they illustrate how substantially the cost of renting has changed.
Mortgage holders have faced their own pressures as borrowing costs increased, particularly when coming off cheaper fixed-rate deals.
And unlike discretionary purchases, housing is a cost households cannot easily avoid.
Transport: Petrol and Diesel Rising Again
Overall transport prices have increased by 20.9% since August 2021, but recent fuel-price increases are particularly concerning.
The latest government road fuel statistics show petrol reaching 175.28p per litre and diesel 200.04p per litre in October.
Since February 2026 alone, petrol has increased by almost 44p per litre and diesel by nearly 59p.
That’s approximately £24 more to fill a 55-litre petrol tank and £32 more for diesel.
For an illustrative petrol driver covering 6,200 miles annually at 40 miles per gallon, the five-year increase added approximately £190 to annual fuel costs by August 2026. At October’s higher prices, that rises to around £286 compared with August 2021.
And the consequences extend beyond motorists.
Higher fuel costs affect hauliers, farmers, delivery companies and manufacturers. Sustained increases can eventually feed through into the prices of goods and services.
Why the Poorest Households Are Hit Hardest
Perhaps the most important finding is that rising prices don’t affect everyone equally.
Lower-income households generally devote a much greater proportion of their spending to essentials, leaving less flexibility when bills increase.
I’ve analysed the latest ONS Family Spending figures for 2024/25, including detailed expenditure figures by household income.
The difference is striking.
The lowest-income fifth of households devoted 40.3% of their total expenditure to food, housing, fuel and power.
For the highest-income fifth, the equivalent figure was just 20.7%.
In other words, lower-income households devoted almost twice the proportion of their spending to these necessities.
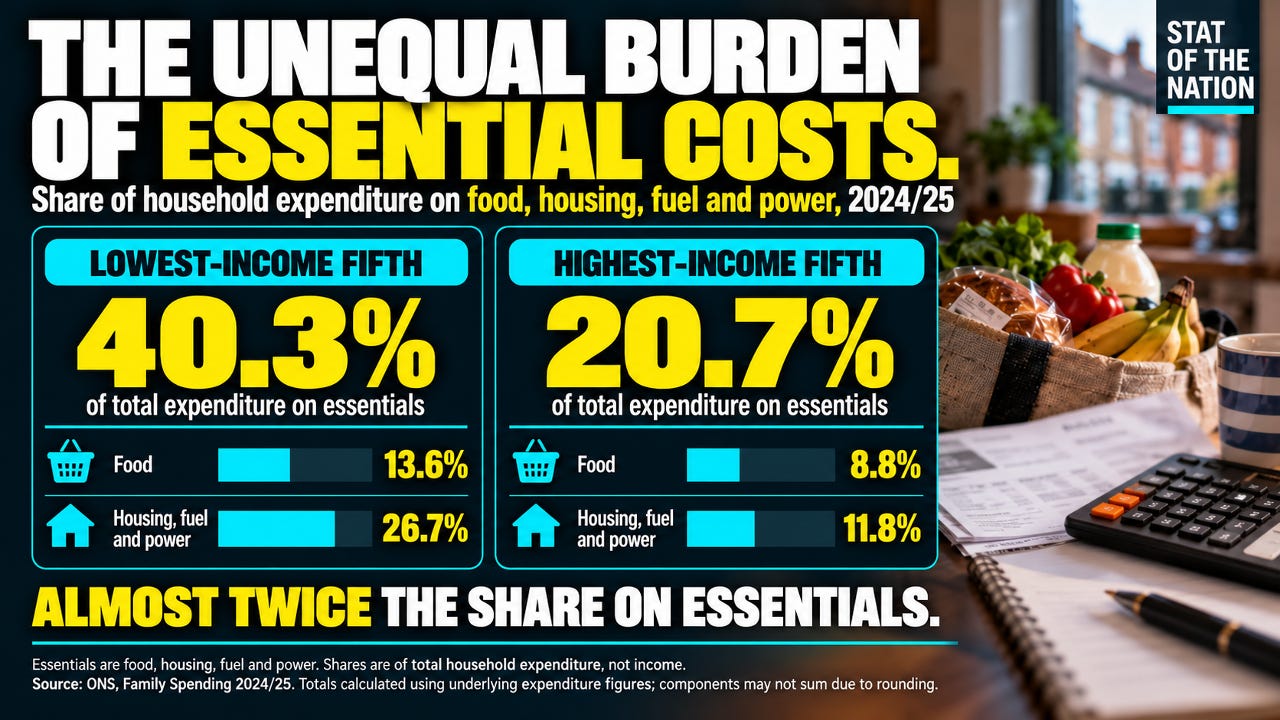
The housing, fuel and power category includes rent and other housing expenses, not simply gas and electricity. These are shares of household expenditure rather than income.
When such a large proportion of household spending is already committed to essentials, there is far less room to absorb further increases.
Have Earnings Kept Up With Rising Bills?
Of course, wages have also increased, helping households absorb some of these higher costs.
According to the ONS average weekly earnings figures, average regular earnings increased by approximately 29.5% between August 2021 and July 2026.
That’s broadly in line with overall inflation, but below the increases in food, energy and average private rents.
And those earnings figures are before tax.
Take someone earning £30,000 a year in 2021. If their salary increased in line with average earnings, they would now earn approximately £38,850.
After Income Tax and employee National Insurance, their annual take-home pay would have increased from approximately £24,062 to £31,492.
That’s an additional £7,430 a year.
But if that worker also faced the higher food, energy, rent and motoring costs in our illustrative household, those increases would absorb approximately 86% of their additional take-home pay.
That leaves just over £1,000 of the annual pay increase to cover rising costs elsewhere.
This is a hypothetical comparison, not the experience of every worker. Income Tax threshold freezes have increased tax liabilities relative to inflation-linked thresholds, while reductions in employee National Insurance have offset some of that effect.
Nevertheless, it illustrates an important point.
Even substantial pay rises can be largely absorbed by higher essential bills, leaving households with little additional spending power.
Looking Ahead: Another Energy Shock in January?
And the concern now is what happens next.
Households have already absorbed five years of substantial price increases, but another significant rise in domestic energy bills could be approaching.
The current Ofgem price cap stands at £1,723 annually for a typical dual-fuel household.
However, MoneySavingExpert’s comparison of energy supplier forecasts from early October suggests the cap could rise by 20.9% in January 2027, reaching approximately £2,084.
That’s another £361 on an annualised basis compared with October.
These are forecasts, not confirmed increases. The January cap will be announced by Ofgem in November, and the additional amount paid during the winter quarter will depend on actual consumption.
But the potential consequences extend beyond household energy bills.
Higher energy costs affect food production, manufacturing, refrigeration, transport and distribution. Businesses may absorb some of those increases, but others could eventually pass them on through higher prices.
Another sustained energy shock risks feeding through into everyday costs, adding further pressure to households already dealing with five years of inflation.
It also creates a challenge for the Bank of England. Higher interest rates cannot directly resolve international energy shortages, although monetary policy remains important in preventing temporary price shocks from becoming persistent inflation.
The five-year figures reveal how much more expensive everyday life has become. And although average earnings have broadly kept pace with overall inflation, the costs of several essential goods and services have risen much faster.
For households already spending a large proportion of their budgets on necessities, that distinction matters.
The real question isn’t simply whether inflation is coming down. It’s whether people can afford the cost of everyday life after five years of sharply rising prices.
✍️ Jamie Jenkins
Stats Jamie | Stats, Facts & Opinions
If you found this analysis useful, please share it and subscribe for more.
📲 Follow me here for more daily updates:
Jamie
You compared the rising costs to someone on £30k but what about someone on benefits and don't forget they get discounts on energy bills, etc.?